10
Feb 2019

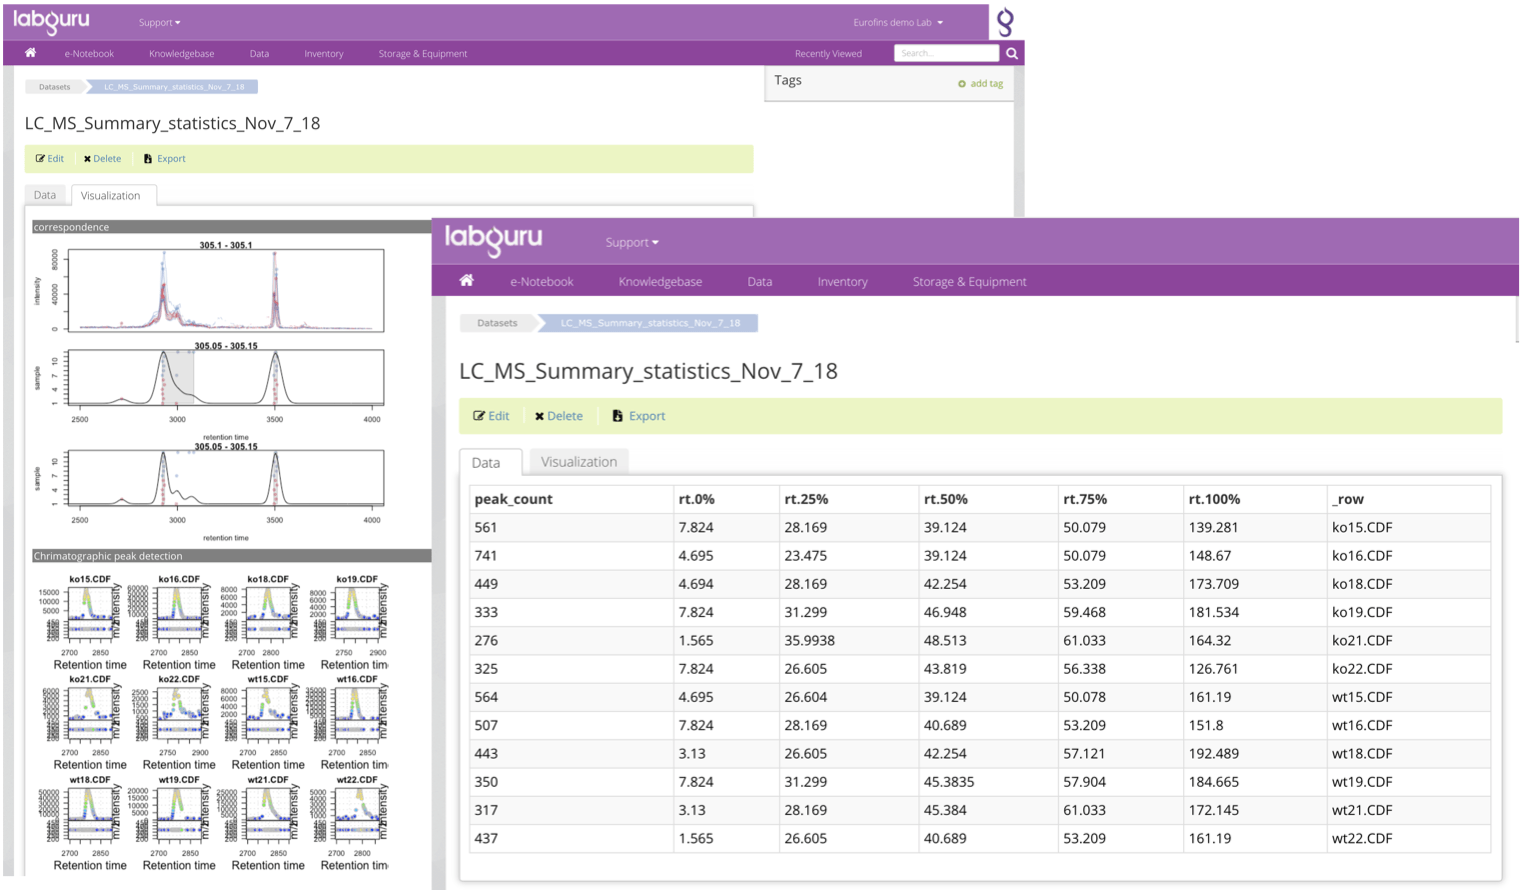
Manage Liquid Chromatography-Mass Spectrometry (LC/MS) Data Analysis
Liquid Chromatography-Mass Spectrometry (LC/MS) instruments are widely used in metabolomics and proteomics research. With...
10
Feb 2019

Liquid Chromatography-Mass Spectrometry (LC/MS) instruments are widely used in metabolomics and proteomics research. With...
22
Jan 2019

"Labguru helps me to keep track of what my team members are doing and allows collaborative analysis of data and experiments....
10
Jan 2019

Life science and pharmaceutical companies are under increasing pressure to reduce costs and improve efficiency. There is no...
17
Dec 2018

2018 was a super year for Labguru. Our major aim is to comply with our customer requests and make sure our product answers...
4
Dec 2018

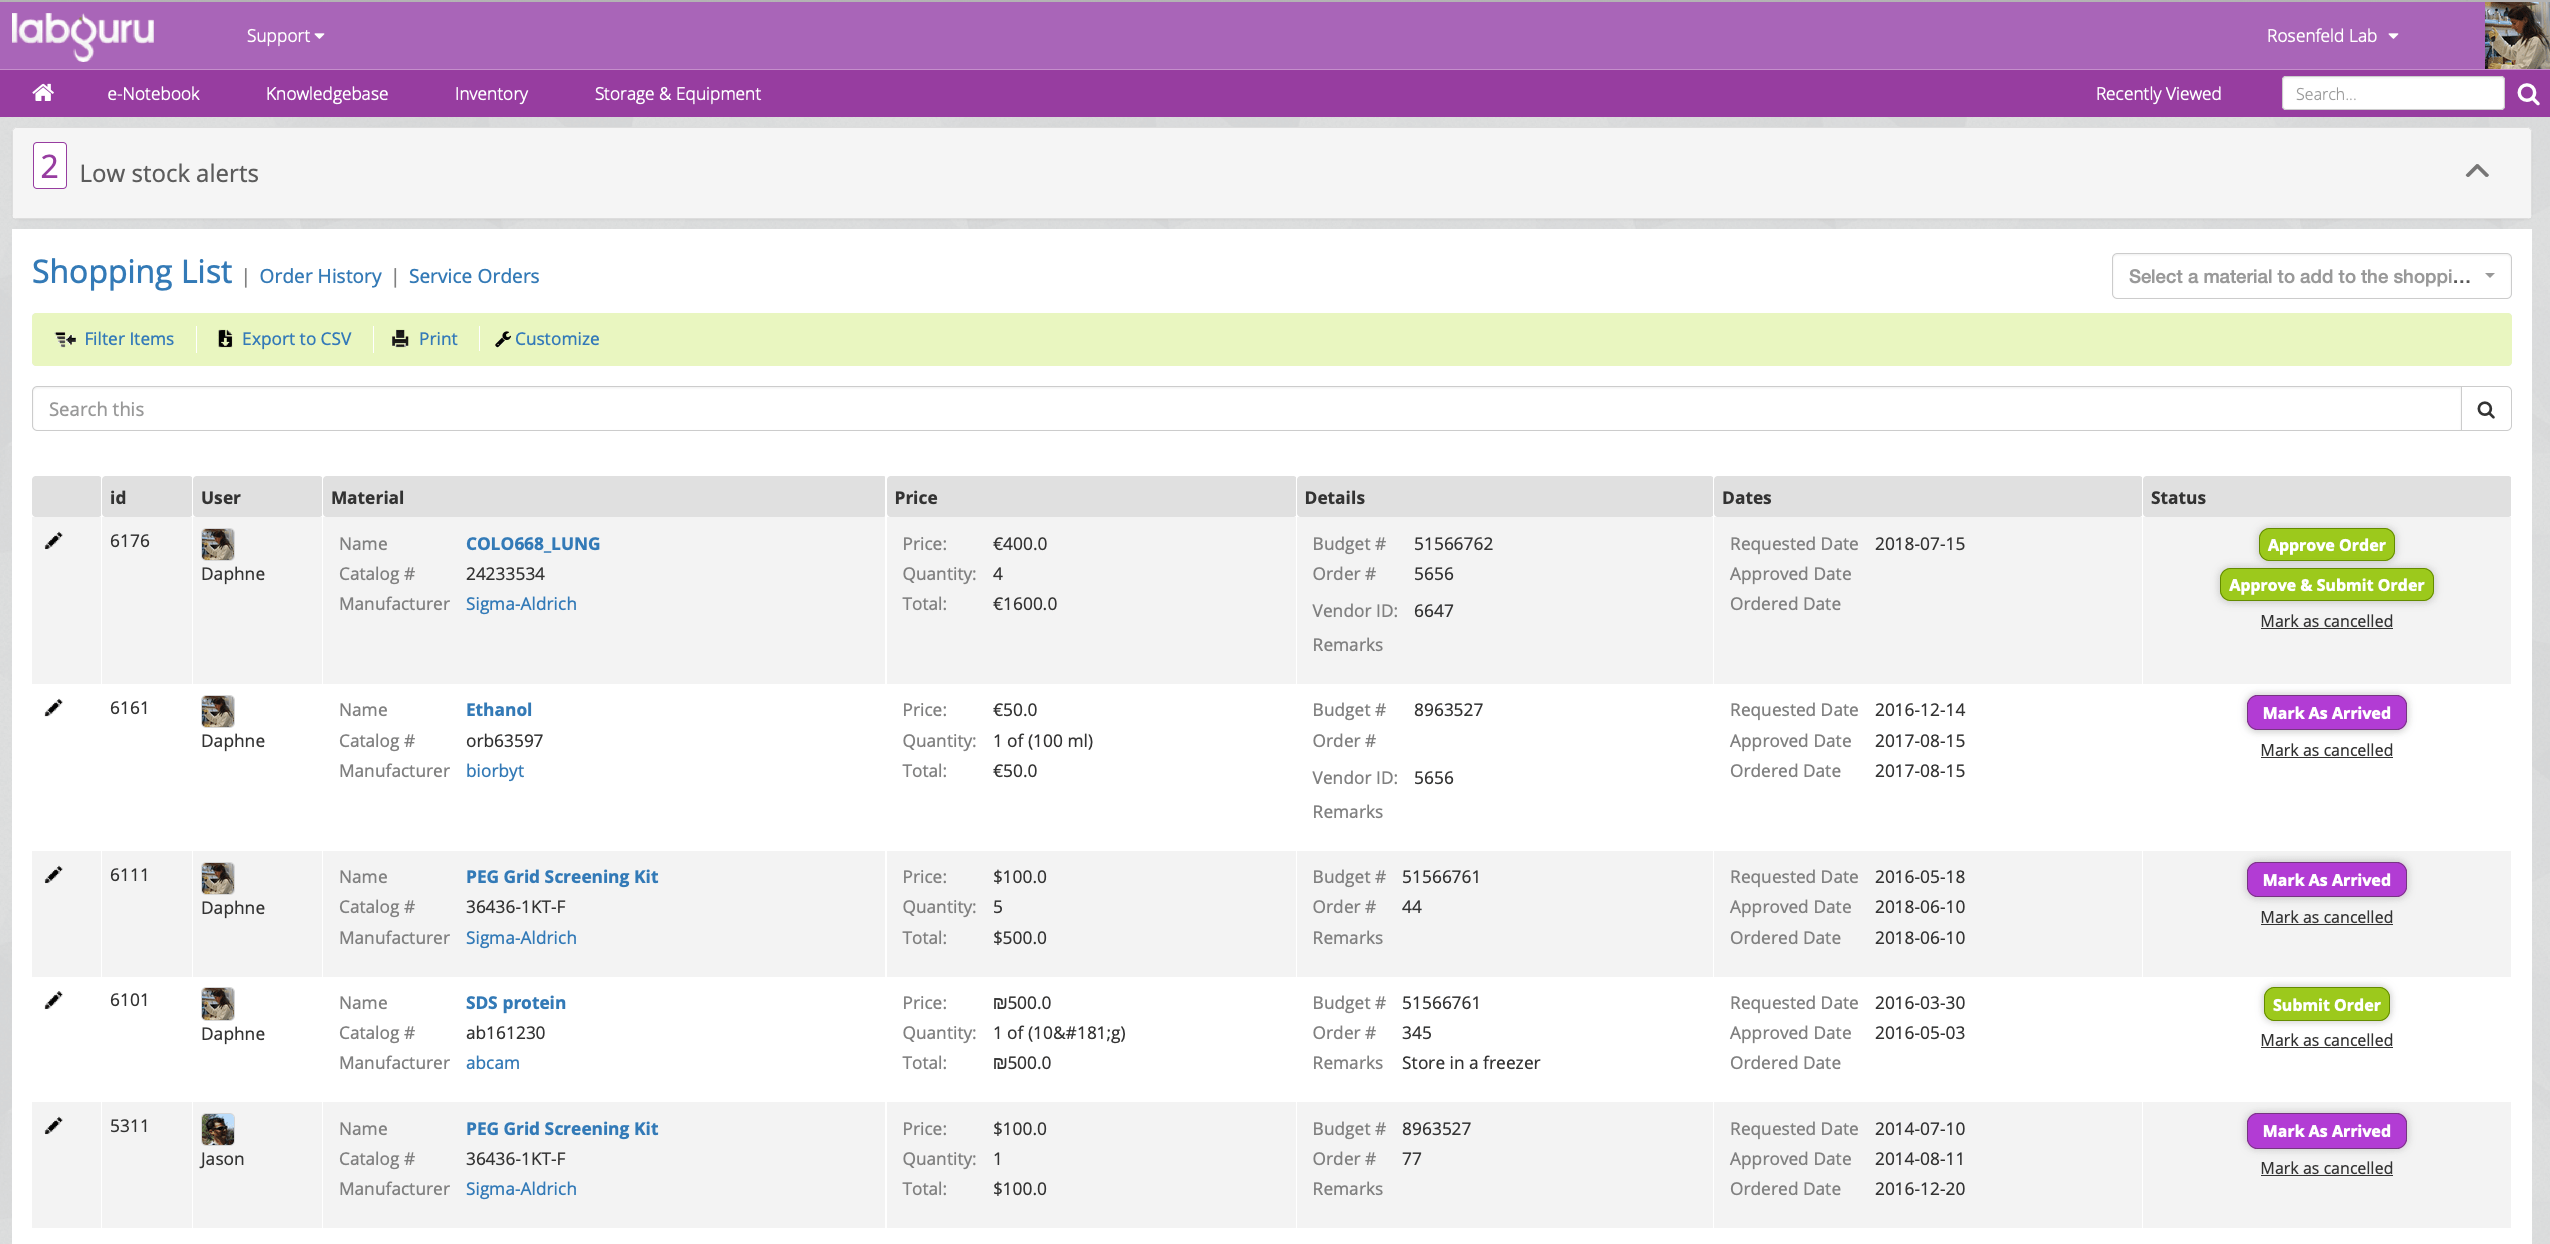
How do you keep track of your lab orders? Still using a clipboard with a pencil tied to it? Using an excel spreadsheet? If...
7
Nov 2018

Success in the world of life sciences and medicine, in particular, has never been as closely linked with successful...
24
Oct 2018

Working in Biodata and developing Labguru over the years allowed me to meet scientists from many companies and exposed me to...
8
Oct 2018

“Labguru changes the way we manage our research. We save time on searching for samples because we use the inventory...
26
Sep 2018

Lab inventory management is an important, yet mundane task and often overlooked task. Effective lab inventory management can...